site_4bbb466c-cafd-4edb-8869-71ed8e60d33a
Excellence in PGR technology
Choosing the best Wastewater Equipment in 2026 requires more than comparing prices, flow rates, or glossy product images. Global buyers face stricter discharge standards, water scarcity, rising energy costs, and aging treatment networks. UNEP’s 2023 report, Wastewater: Turning Problem to Solution, estimates that roughly 80% of global wastewater remains untreated. The United Nations World Water Development Report 2024 also links water quality, climate pressure, and public health risks. These findings make reliable treatment technology a practical necessity, not a luxury.
This guide evaluates screening systems, grit removal units, clarifiers, biological reactors, membrane systems, sludge dewatering equipment, and disinfection solutions. It considers capacity, influent variation, energy demand, maintenance access, spare-part availability, and operator skills. A compact MBR may suit a hotel or industrial park, while a robust oxidation ditch may perform better in a municipal plant with limited technical support. Details matter, including stainless-steel grade, blower efficiency, membrane cleaning intervals, and control-panel protection.
The “best” option is rarely universal. That deserves honest reflection. A high-performance system can fail when commissioning support is weak or replacement parts arrive slowly. The World Bank’s Quality Unknown report highlights how poor wastewater quality data can weaken investment decisions. Therefore, buyers should verify laboratory results, pilot-test uncertain applications, and request references from comparable sites. Equipment claims still need evidence. This 2026 overview combines engineering principles, published industry research, and field-oriented purchasing considerations, while recognizing that local conditions can overturn a ranking.
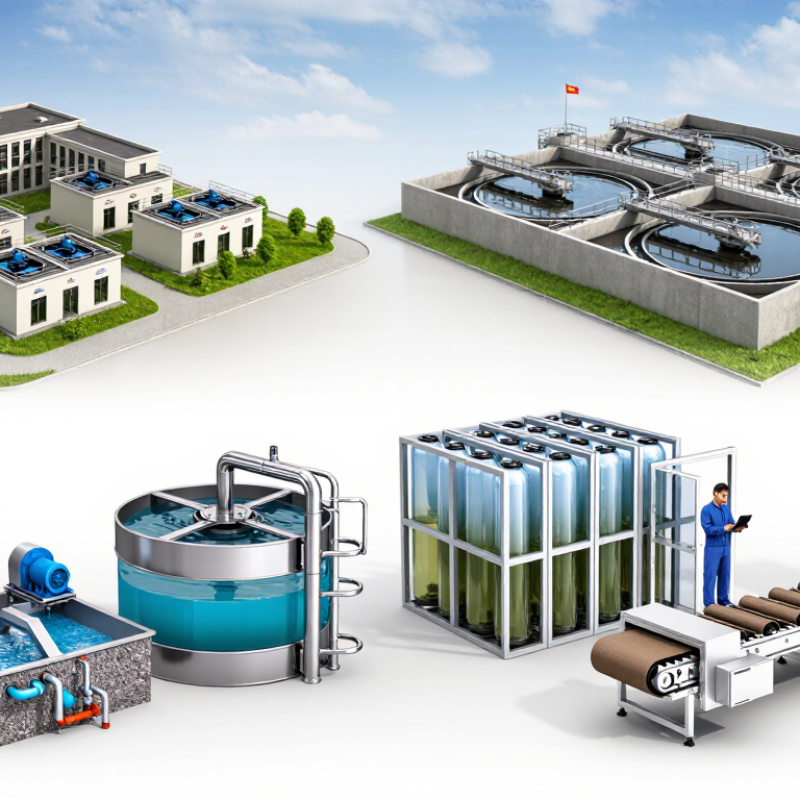
The 2026 wastewater equipment market is moving toward one urgent goal: safely treating 80% of wastewater worldwide. This target requires more than buying advanced machines. Buyers must match equipment with flow rates, pollution loads, climate, operator skills, and discharge requirements. A compact treatment train may include bar screens, grit removal, biological treatment, clarification, filtration, and disinfection. Each stage protects the next one.
Reliable systems start with accurate data. Flow meters should record daily peaks, not only average volumes. Online sensors can track dissolved oxygen, turbidity, pH, and ammonia. These readings help operators adjust aeration before energy costs rise. Membrane systems can produce high-quality water, but fouling remains a practical concern. Regular backwashing and cleaning are essential. Sludge dewatering equipment also matters, because wet sludge increases transport and disposal costs. Small details often decide plant performance.
Global buyers should examine spare-part access, training, warranty terms, and service response times. A low purchase price may hide difficult maintenance. Remote monitoring helps, but it cannot replace skilled local workers. No treatment train is perfect. Unexpected storms, power interruptions, and changing wastewater composition can reduce performance. Equipment selection should therefore include backup power, bypass protection, and clear emergency procedures. The better choice is not always the most complex system. It is the system operators can safely run every day.
2026 Best Wastewater Equipment for Global Buyers
Primary, secondary, and tertiary equipment should match the treatment goal, not only the project budget. Primary treatment begins with screens, grit removal, and settling tanks. These units protect pumps and reduce heavy solids before biological treatment. In real plants, a blocked screen can disrupt an entire shift. Keep access simple.
Secondary equipment removes dissolved organic matter through biological processes. Aeration tanks, diffusers, mixers, and clarifiers must work as one system. Operators should check oxygen levels, sludge settling, and power use every day. A reliable design allows safe cleaning without stopping the whole line. Small details matter.
Tertiary treatment targets the final water quality. Disc filters, membrane systems, ultraviolet units, and chemical dosing equipment may support reuse or sensitive discharge goals. Select equipment after testing local water conditions, seasonal flow, and operator skills. A sophisticated system can underperform when spare parts are unavailable. This is easy to overlook. I have seen energy estimates change after real influent data arrived. Therefore, buyers should request pilot testing, clear maintenance records, sensor calibration plans, and verified performance data. Targets for 2026 should include stable compliance, lower energy use, reduced sludge, and practical long-term operation. Perfect projections are rare. Review them honestly.
2026 Best Wastewater Equipment for Global Buyers
MBR, SBR, and MBBR Systems: Comparing 90–99% BOD Removal Performance
For global buyers, BOD removal should guide equipment selection, not marketing claims. MBR systems commonly achieve 95–99% BOD removal when membranes remain clean and biological loading stays controlled. They produce clear effluent, but need energy for aeration and membrane filtration. SBR systems often deliver 90–98% removal through timed fill, react, settle, and decant cycles. Their performance depends heavily on cycle settings and sludge settling. MBBR systems can reach about 90–97% removal with attached biofilm carriers. They tolerate flow changes well, although final polishing may be necessary.
Tips: Request pilot data using your actual wastewater. Check influent BOD, temperature, salinity, peak flow, and discharge limits. Ask for power consumption and cleaning frequency, not only removal percentages.
A 99% result on paper can disappoint in winter. Temperature changes slow biological activity. Poor equalization can also overload the reactor within hours. In practical evaluation, operators should inspect dissolved oxygen, sludge age, membrane pressure, and ammonia trends. MBR is often suitable where land is limited and reuse quality matters. SBR may fit sites needing flexible batch operation and simpler solids separation. MBBR can be practical for upgrades, especially when existing tanks must remain in service. These ranges overlap. System design, operator skill, and maintenance discipline often matter more than the process label.
| Evaluation Dimension | MBR System | SBR System | MBBR System |
|---|---|---|---|
| Process Configuration | Biological treatment combined with membrane filtration, usually using submerged or sidestream microfiltration or ultrafiltration membranes. | Fill, react, settle, decant, and idle phases are performed sequentially in the same biological reactor. | Attached-growth biological treatment using suspended plastic carrier media retained inside an aerated or anoxic reactor. |
| Typical BOD5 Removal | 95–99% with suitable design and operation | 90–97% with adequate biological loading, aeration, and settling | 90–96% in a well-designed carbon-removal configuration |
| Typical Effluent BOD5 | Generally below 5–10 mg/L when properly operated | Commonly about 10–30 mg/L, depending on cycle control and influent characteristics | Commonly about 10–30 mg/L, depending on media fill fraction, loading, and downstream clarification |
| Suspended Solids in Final Effluent | Typically below 1–5 mg/L because the membrane acts as a physical solids barrier | Often about 10–30 mg/L; performance depends on sludge settling and decanting | Often about 10–30 mg/L after secondary clarification; a tertiary filter may be required for stricter limits |
| Nitrification Potential | High, because the process can maintain high biomass concentrations and long solids-retention times | Moderate to high when sufficient aerated reaction time and sludge age are provided | Moderate to high; additional anoxic or aerobic stages may be needed for reliable nitrogen removal |
| Hydraulic Retention Time | Commonly about 2–8 hours for the biological tank, subject to influent strength and treatment objectives | Commonly about 6–14 hours per cycle-based process design | Commonly about 3–8 hours per biological stage, subject to loading and treatment targets |
| Typical Mixed Liquor or Media Conditions | MLSS often about 8,000–15,000 mg/L; membrane flux and fouling control are critical | MLSS often about 2,500–6,000 mg/L; settling characteristics strongly affect decant quality | Carrier fill fraction commonly about 30–70% of reactor volume; biofilm grows on protected media surfaces |
| Land Requirement | Low | Medium | Low to medium |
| Energy Demand | High | Medium | Medium |
| Key Energy Drivers | Fine-bubble aeration, membrane scouring, permeate pumping, and periodic cleaning | Aeration, mixers where required, decanter operation, and intermittent cycle control | Aeration for carrier mixing and biological oxidation; pumping requirements depend on layout |
| Sludge Production | Low to medium, although waste activated sludge still requires handling | Medium; sludge wasting and settling performance must be managed | Low to medium; attached growth can reduce observed sludge production compared with conventional activated sludge |
| Footprint Advantage | Usually the smallest footprint for high-quality reuse or discharge effluent | Can reduce civil works because equalization, biological treatment, settling, and decanting occur in shared basins | Can increase treatment capacity in existing tanks by adding protected carrier surface area |
| Operational Complexity | High | Medium | Medium |
| Main Maintenance Requirements | Membrane cleaning, fouling monitoring, air-scour control, pumps, instrumentation, and periodic membrane replacement | Valve and decanter maintenance, blower servicing, cycle programming, sludge wasting, and settling control | Blower and mixer maintenance, carrier-retention screens, biofilm management, and secondary clarification |
| Hydraulic Shock Tolerance | Good biological resilience, but membranes require protection from fibrous solids, grease, and abrasive materials | Moderate; equalization and flexible cycle control are beneficial for variable flows | Good biological resilience; hydraulic surges can still affect clarification and carrier-retention equipment |
| Best-Fit Applications | Water reuse, compact municipal plants, hotels, hospitals, commercial buildings, and sites with strict solids limits | Small to medium municipal plants, industrial wastewater with batch or variable flows, and locations requiring flexible cycle operation | Municipal upgrades, industrial pretreatment, decentralized systems, and projects seeking capacity expansion within existing tanks |
| Primary Advantages | Excellent solids separation, high-quality effluent, compact footprint, and strong pathogen-reduction capability when properly designed | Flexible batch operation, relatively simple process layout, and the ability to combine several treatment phases in one basin | High protected biofilm area, resistance to biomass washout, compact biological stages, and suitability for retrofit projects |
| Primary Limitations | Higher capital and energy costs, membrane fouling risk, and greater operator skill requirements | Requires reliable automation and sufficient time for settling and decanting; continuous inflow may require equalization | Usually needs downstream clarification or filtration; carrier screens and aeration systems require regular inspection |
| Typical Pretreatment Needs | Fine screening, grit removal, grease control, and reliable flow equalization are strongly recommended | Screening and grit removal are normally required; equalization is useful for highly variable influent | Screening, grit removal, and protection of carrier-retention screens are normally required |
| Global Buyer Selection Priority | Choose when effluent quality, water reuse, and limited land are more important than minimum energy consumption. | Choose when batch flexibility, moderate capital cost, and variable loading are important selection factors. | Choose when upgrading an existing plant, increasing biological capacity, or maintaining process resilience is the priority. |
Note: The performance ranges are typical engineering values, not guaranteed results. Actual removal depends on influent BOD5, temperature, toxicity, hydraulic and organic loading, nutrient balance, dissolved oxygen, solids-retention time, pretreatment, operator control, and local discharge requirements. BOD5 refers to five-day biochemical oxygen demand.
For global buyers, 0.3–0.6 kWh/m³ aeration range is a practical screening benchmark. It is not a guaranteed result. The U.S. EPA’s wastewater energy guidance reports that aeration may consume roughly 45–75% of a treatment plant’s electricity. That share makes blower selection especially important.
Field assessments show that oxygen demand changes with influent strength, temperature, sludge age, and flow variation. Fine-bubble diffusers can improve oxygen transfer, while variable-frequency drives reduce unnecessary airflow during low-load periods.
Reliable dissolved oxygen sensors matter too. Poor calibration can quietly increase power use. Flow changes everything.
Procurement teams should request measured kWh/m³ data, not only motor efficiency figures. Ask for performance at average, peak, and minimum flow. The European Commission’s wastewater BAT reference documents also emphasize process control, oxygen-transfer efficiency, and energy monitoring as practical improvement areas. A system achieving 0.4 kWh/m³ at stable loading may exceed 0.6 kWh/m³ during cold weather or storm flow. The range is real. The boundary is often unclear.
A fair comparison should define whether pumping, mixing, and controls are included. Site tests should cover several operating conditions, preferably across seasons. Otherwise, a neat spreadsheet can hide an expensive assumption.
Global buyers should treat 0.1 mg/L phosphorus as a verified performance target, not a brochure promise. Local discharge permits may define total phosphorus, sampling frequency, seasonal limits, or stricter watershed conditions. Ask for compliance records from comparable plants, not only laboratory removal percentages. Confirm whether the limit applies to daily averages, monthly averages, or individual samples. Small differences matter.
A practical treatment train may combine biological phosphorus removal, metal-salt dosing, tertiary filtration, and sludge dewatering. Chemical dosing needs dependable pumps, proper mixing, storage protection, and flow-based control. Online phosphorus analyzers can reveal process drift, but operators must validate them through scheduled laboratory tests. Request jar-test data using your wastewater, including low-temperature and high-flow conditions. Measure the sludge burden. Extra precipitate can increase disposal costs and reduce clarifier capacity.
Before purchasing, compare guaranteed outlet values with influent ranges, pH limits, power demand, spare parts, and operator training. Require a commissioning plan with sampling points before and after each treatment barrier. Independent verification is valuable during the first operating months. Yet no system removes uncertainty. Stormwater dilution, sensor fouling, chemical quality, and changing industrial loads can disrupt results. Field experience shows that stable pilot data may weaken at full scale when maintenance routines are vague. Leave room for adjustment.
Representative total phosphorus concentrations achievable with commonly used treatment configurations. Actual results depend on influent quality, temperature, chemical dosing, filtration, operating control, and the applicable local permit.
The 0.1 mg/L line represents an advanced phosphorus target for stringent discharge or water-reuse applications. Buyers should confirm the permitted limit, sampling method, averaging period, and guaranteed operating range with the local regulator and equipment supplier.
| Cookie | Duration | Description |
|---|---|---|
| _wpfuuid | 11 years | This cookie is used by the WPForms WordPress plugin. The cookie is used to allows the paid version of the plugin to connect entries by the same user and is used for some additional features like the Form Abandonment addon. |
| cookielawinfo-checkbox-analytics | 11 months | This cookie is set by GDPR Cookie Consent plugin. The cookie is used to store the user consent for the cookies in the category "Analytics". |
| cookielawinfo-checkbox-functional | 11 months | The cookie is set by GDPR cookie consent to record the user consent for the cookies in the category "Functional". |
| cookielawinfo-checkbox-necessary | 11 months | This cookie is set by GDPR Cookie Consent plugin. The cookies is used to store the user consent for the cookies in the category "Necessary". |
| cookielawinfo-checkbox-others | 11 months | This cookie is set by GDPR Cookie Consent plugin. The cookie is used to store the user consent for the cookies in the category "Other. |
| cookielawinfo-checkbox-performance | 11 months | This cookie is set by GDPR Cookie Consent plugin. The cookie is used to store the user consent for the cookies in the category "Performance". |
| viewed_cookie_policy | 11 months | The cookie is set by the GDPR Cookie Consent plugin and is used to store whether or not user has consented to the use of cookies. It does not store any personal data. |
| Cookie | Duration | Description |
|---|---|---|
| CONSENT | 2 years | YouTube sets this cookie via embedded youtube-videos and registers anonymous statistical data. |
| vuid | 2 years | Vimeo installs this cookie to collect tracking information by setting a unique ID to embed videos to the website. |